| |
How to Conduct Analysis - Open
Page history
last edited
by PBworks 16 years, 1 month ago
How to Conduct Analysis - Open
Analyzing the Data
- The first step in analyzing your data is to plug all of the information into a spreadsheet and start tabulating it. The easiest way to do this is to put all of the items or "cards" in rows in a column on the left and then start to enter all of the different labels your participants created across the top of the spreadsheet as column headers. You can then fill in hash marks across, denoting how many people placed each card into a particular category.
- If you have done an online card sort, you should be able to access a tab-delimited file which can be exported into an Excel file providing you with a jump-start on entering your data, although you will need to format it so that it's in the above suggested format.
.  download analysis spreadsheet
- As you are entering labels from your participants, it may be very obvious that several people have created labels which are variants on the same thing such as About, About Us, About the Library, etc. It is appropriate at this point to combine all of them into one category and tally up all of the associated cards under that heading.
- Once all the hash marks are entered, it's a good time to start looking for similarly labeled categories which can be combined, perhaps some which you weren't sure about at the beginning, but after seeing the same content items placed into each of them you are now ready to make them one category. This is good for labels which may have been things like online services, online resources, online, etc.
- After you have combined these categories, you should start to see your dominant labels emerge as well as begin to be able to identify problem items which have been placed into different categories by the majority of participants.
- All the while it is important for you to pay close attention to how your users are labeling your information - are they creating brand new categories which you aren't currently using on your website? Are they overwhelmingly placing items into different categories than you expected?
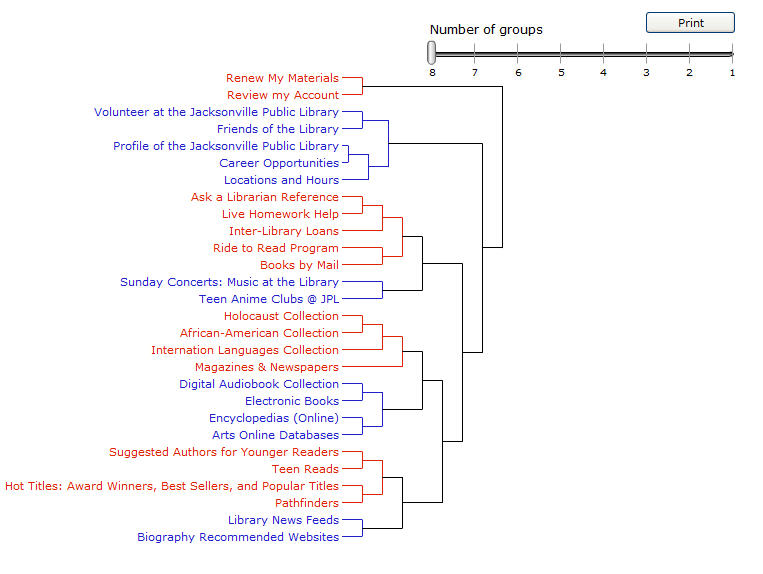
- You may also want to look at a graphical representation of how content items were grouped by your participants. A tree diagram or dendogram is available through web-based card-sorting programs and will display a cluster analysis of your content items.
. 
Analysis Tips
- Bear in mind that analysis is part art, part science
- Much of the analysis boils down to "eyeballing" trends in the results
- Expect it to be "messy"
How to Conduct Analysis - Open
|
|
Tip: To turn text into a link, highlight the text, then click on a page or file from the list above.
|
|
|

Comments (0)
You don't have permission to comment on this page.